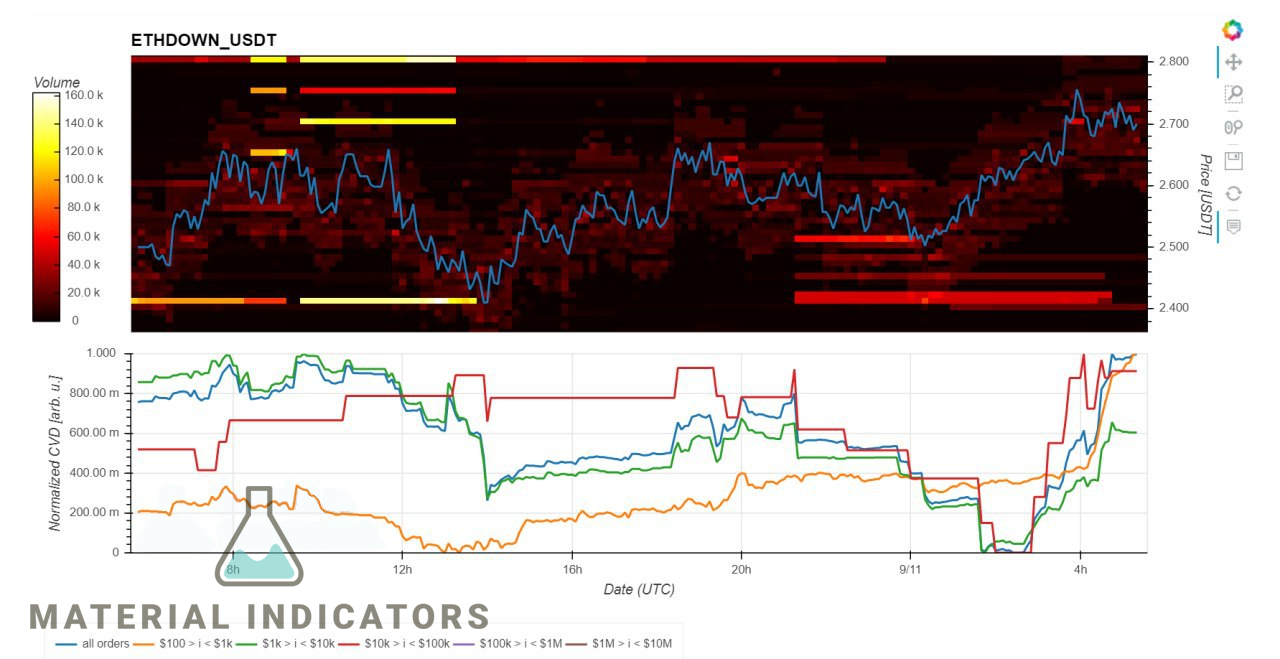
Fire Charts empower you to replace speculative decisions with data based decisions by providing a high resolution view of the order book and order flow (CVD). Color scaling lets you visually identify precise levels of resistance, support and liquidity on the Fire Charts heat map, and our proprietary CVD chart shows you exactly when whales are making market orders that impact price action.
Fire Charts are heat maps of the order book that allow you to call up BTC and USDT coin pairs and see a visual representation of resistance, support and liquidity as it sits in the order book.
Color scaling tells you the density of the trading volume. Zoom and price data tools make it easy to identify targets with laser precision, making Fire Charts a premium tool to help you identify opportunities and mitigate risk.
Our CVD (Cumulative Volume Delta) indicator takes order flow visualization to another level. Our proprietary, binned CVD chart gives a visual representation of order flow, illustrating when whales, sharks and retail traders are making market orders that impact price action. Let’s face it, we don’t all have the money to be whales, but this powerful tool makes it easy to swim with them.
Many members of our Telegram trading community use Fire Charts to help validate signals they’ve received and also to identify trading opportunities that may not necessarily be associated with a specific signal. Using Fire Charts order book and order flow visualization tools to identify opportunities, validate setups and mitigate risk empowers you to replace speculative trading decisions with data driven decisions. See samples of Fire Charts and discussions around them flowing in our Telegram channel.
Get news, updates, and offers from Material Indicators
You have successfully joined our subscriber list.
| Cookie | Duration | Description |
|---|---|---|
| cookielawinfo-checkbox-analytics | 11 months | This cookie is set by GDPR Cookie Consent plugin. The cookie is used to store the user consent for the cookies in the category "Analytics". |
| cookielawinfo-checkbox-functional | 11 months | The cookie is set by GDPR cookie consent to record the user consent for the cookies in the category "Functional". |
| cookielawinfo-checkbox-necessary | 11 months | This cookie is set by GDPR Cookie Consent plugin. The cookies is used to store the user consent for the cookies in the category "Necessary". |
| cookielawinfo-checkbox-others | 11 months | This cookie is set by GDPR Cookie Consent plugin. The cookie is used to store the user consent for the cookies in the category "Other. |
| cookielawinfo-checkbox-performance | 11 months | This cookie is set by GDPR Cookie Consent plugin. The cookie is used to store the user consent for the cookies in the category "Performance". |
| viewed_cookie_policy | 11 months | The cookie is set by the GDPR Cookie Consent plugin and is used to store whether or not user has consented to the use of cookies. It does not store any personal data. |